
Why AI Gains Are Real and Your Balance Sheet Doesn't Show It
- Sebastian Sussmann

- May 25
- 15 min read
Updated: May 28
Why measured AI gains at the task level keep failing to show up in productivity data — and what we measure instead at Axon Active.
According to Stack Overflow's 2025 Developer Survey, 84% of developers now use or plan to use AI tools. Most organizations see no measurable improvement on the metrics that matter.
That sentence is the question every CTO and CFO is privately wrestling with. Pilot reports show 20–50% time savings on coding tasks. Vendors quote impressive headline numbers. Studies in Management Science find 26% throughput gains across nearly five thousand developers at major enterprises. And yet, when finance closes the books on the year, the productivity bump is hard to find. The cycle time has not improved. The defect rate has not dropped. The team is shipping roughly the same amount of value, with more AI tooling expense on the line.

This is not because the studies are wrong, or because the developers are exaggerating. The task-level gains are real. The gap is somewhere else — in the long, badly-instrumented chain between an individual task speeding up and a business outcome improving. This post is about that gap. What it is, where the value leaks out, and what we measure at Axon Active to make sure the gains we promise our clients are the ones their finance team can see.
You can speed up the engine. But if the road has traffic, you're still stuck.
The benchmark trap
The AI-and-productivity debate is full of strong numbers. They are not lies. They are answers to the wrong question.
Worth pausing first on the baseline AI is being measured against. Before AI tools entered the picture, McKinsey's research found that technical debt typically accounts for around 40% of IT balance sheets, with 30% of CIOs reporting that more than 20% of their technology budget is diverted to resolving tech debt issues rather than building new value. Stripe's Developer Coefficient report found 42% of professional developer time goes to managing technical debt. In other words: a meaningful fraction of every developer's week was already disappearing into maintenance and rework before AI came along. The relevant question is not whether AI makes coding faster. It is whether AI compresses or expands that pre-existing tax — and on the evidence, the answer depends almost entirely on how the team is governed.
At the level of a single task, the evidence is now substantial. Brynjolfsson, Li, and Raymond's Generative AI at Work, a customer-support field experiment with 5,179 agents, found a 14% productivity gain on average — and 34% for novices. A Google enterprise randomized trial by Paradis and colleagues found developers worked roughly 21% faster on coding tasks. The largest study to date — Cui et al., Management Science 2026 — measured 4,867 developers across Microsoft, Accenture, and a Fortune 100 firm and found a 26.08% increase in completed tasks.
Our own pilot data lines up: 20–25% with GitHub Copilot, 25–30% with Cursor, 30–50% with Claude Code, measured across our pilot teams over six months. The gains depend on project size, codebase complexity, the model's context window, the kind of work, and the developer's familiarity with the tool. Vendors quote single numbers because they sell tools. We measure ranges because we ship outcomes. But across the variation, the gains are there. The debate at the task level is over.
Then comes the awkward question. If individual tasks are 20–50% faster, why is corporate productivity not 20–50% higher? Why do most enterprises struggle to point to material EBIT impact from generative AI? Why does the St. Louis Fed's analysis suggest the economy-wide productivity contribution is closer to one percentage point per year than to anything resembling a transformation?
Because the benchmark is measuring the wrong thing. A benchmark measures how fast a developer completes a task. The balance sheet measures whether the customer got more value. Between those two there is an entire chain of work — code review, QA, deployment, integration, support, customer feedback — and AI does not accelerate most of it. In some cases AI actively slows it down.
A benchmark measures how fast a developer completes a task. The balance sheet measures whether the customer got more value. The gap between those two is where almost every AI productivity claim breaks.
Where the gains disappear
If you watch a sprint closely, the AI gain is visible. The developer using Cursor or Claude Code does in two hours what previously took three. That is real. The disappearance happens later, in places most measurement frameworks do not look.
Five places, specifically:
Where it leaks | What happens |
Verification overhead | AI generates faster than humans can verify. The minutes saved on the prompt are spent — and often more than spent — in the review window. In a published worked example of an agentic compliance workload, monthly token cost was $25 and monthly human review cost was $29,000. The ratio that matters is the second one. |
Workslop | AI-generated content that looks formally plausible but is substantively thin and requires downstream rework. A 2025 BetterUp / Stanford Social Media Lab study of 1,150 US workers found 40% reported receiving such output in the past month. Each incident cost roughly two hours to deal with. What looks like one team's efficiency reappears as another team's rework. |
Approval fatigue | BCG's 2026 Brain Fry study of 1,488 US workers found about 14% of AI users reporting cognitive exhaustion from constantly supervising and evaluating AI output. After enough Accept clicks, attention degrades. The AI is now unsupervised whether the reviewer meant it or not. |
Skill atrophy | An Anthropic study of 52 developers learning a new library found that heavy AI use made them marginally faster but led to 17% worse results on a knowledge test — with the difference depending entirely on whether AI was used for explanations or for delegating the work. Speed today, weaker foundation tomorrow, unless the use is actively governed. |
The incentive problem | Workers have good reasons to keep quiet about time savings, because admitting that a task that once took five hours now takes three opens the door to a heavier workload. Executives and tool vendors have the opposite problem: they need to justify budgets. Neither side is lying. They just see different things — and the productivity number that emerges from the gap is unreliable in both directions. |

Each of these by itself is small. Together, they routinely consume the entire task-level gain — and sometimes more. Consider a hypothetical team with a 30% velocity gain at the coding step. The same team spends an extra two hours per week reviewing thinly-disguised AI output, an extra hour or two on cognitive recovery from constant supervision, additional time per quarter helping juniors who delegated their learning to AI relearn fundamentals, and quietly buffers a few hours of saved time into communication overhead. The arithmetic is illustrative — but the pattern is real, and across our pilot squads we have seen sprint-level gains that vanish almost entirely by the time work reaches the customer. The work moved. The output did not.
This is not a hypothetical pattern. It is what the published productivity research keeps finding. The Danish registry study by Humlum and Vestergaard linked AI usage surveys with administrative labor-market data and found zero effects on income or recorded work hours two years after chatbots arrived. The St. Louis Fed found average time savings of 5.4% of working hours among active users — which dilutes to 1.4% across the workforce, and translates to a potential productivity gain of roughly 1.1% only under assumptions that the saved time gets converted into value-creating work. The European firm-level study by Aldasoro and colleagues found a 4% labor productivity gain on average — but only in firms that had already made complementary investments in software, data, and training. The gain is real. The conditions for capturing it are demanding.
The veteran Silicon Valley engineer Bill Cox, who has personally written more than 240,000 lines of production code under AI supervision, gives perhaps the most direct illustration of what is at stake. In one of his projects, the same engineer with the same AI model produced 35,000 lines of clean, shipping code. In another, the same engineer with the same tools produced 58,000 lines that mostly had to be thrown away. The variable was governance — what Cox calls the harness. What determines whether AI gains land on your balance sheet is rarely the model. It is the structure your team builds around it.
Why most AI measurement fails
The standard AI productivity dashboard tracks: lines of code generated, tickets closed, drafts produced, prompts run, hours self-reported as saved. All of these are activity metrics. None of them are value metrics. As soon as a metric measures activity, the system optimizes for the metric — not for the value it was supposed to represent.
Jan Sauermann's labor economics research describes this distortion well: once a specific observable metric feeds into evaluations or incentives, people optimize for that metric. AI makes the problem worse, because AI produces an extraordinary volume of countable outputs. More drafts. More PRs. More tickets touched. Dashboards fill up with green numbers. Senior leadership sees motion. The customer sees nothing different.
The fix is structural. We measure five different things at Axon Active, and explicitly distrust five common substitutes.
✓ What we measure | ✗ What we don't trust |
Cycle time Task start → PR merged. Trending down once the team settles in = real gain. | 'Feels faster' Significant gap between perception and objective measurement (METR, 2025). |
PR review time Goes up during transition. Means review is happening. | AI tool usage count Activity is not productivity. Usage without governance is noise. |
Defect density Bugs per feature. Stable or decreasing after transition. Key quality signal. | Lines of code written AI inflates volume. More code equals more review burden, not more value. |
Velocity accuracy Planned vs delivered vs team confidence. | Velocity self-report Teams overestimate consistently. We stopped asking and started measuring. |
Code duplication Monitored per codebase. Increases in AI codebases without governance. | PR count per sprint AI generates larger PRs. Count is meaningless without quality context. |

Two of these deserve a short note.
Cycle time, not task completion time. We measure the time from a task being started to the corresponding pull request being merged into the main branch and accepted as Done. That captures everything between the start and the customer-visible result. A 30% AI speed-up on the coding sub-step that vanishes during a longer review will show up as flat cycle time. A real gain shows up as cycle time trending down once the team has settled into the new way of working.
PR review time as a positive signal. In every transition we have run, PR review time goes up significantly in the first sprints. This is expected and necessary. It means the review is happening, not being skipped. A team that adopts AI without review time increasing is not adopting AI safely — it is offloading the review burden to whoever finds the bug in production.

We are also introducing survivorship as our most honest measure of AI's contribution — the share of AI-assisted code that endures unchanged in production over time. Lines generated is a vanity metric. Lines that ship and stay shipped is the real one. The handbook's measurement chapter currently tracks the five metrics above; survivorship is the metric we are building toward, with pilot measurement starting in selected squads.
Stepping back, a comprehensive measurement framework for AI in knowledge work needs at least five levels: cycle time of full processes, error and rework rates, quality, customer value, and economic impact. Our current measurement covers the first three rigorously and the fourth indirectly through client-facing satisfaction tracking. Direct measurement of economic impact — revenue, margin, conversion attributable to AI-assisted delivery — is the harder horizon, and the one most consultancies skip entirely because it requires honest cooperation with finance teams across the client boundary. We are building toward it with the most transparent clients first. The principle is the same one that runs through everything we measure: activity is not value, and the question is always whether the customer ended up better off.

The DORA metrics — Deployment Frequency, Lead Time for Changes, Mean Time to Restore, Change Failure Rate — measure delivery health, not output volume. They are the right scoreboard when AI is in the loop.
Flow governance — what it actually means
Software delivery is a chain. Requirements feed planning. Planning feeds the sprint. The sprint feeds code review. Code review feeds QA. QA feeds deployment. Deployment feeds customer feedback. Customer feedback feeds the next requirements cycle. AI accelerates one of those links — the sprint, specifically the part where developers are writing code. It does not accelerate the other six. Code review and QA, in particular, get heavier — more code to review, more output to test, more decisions to make under the same time budget.
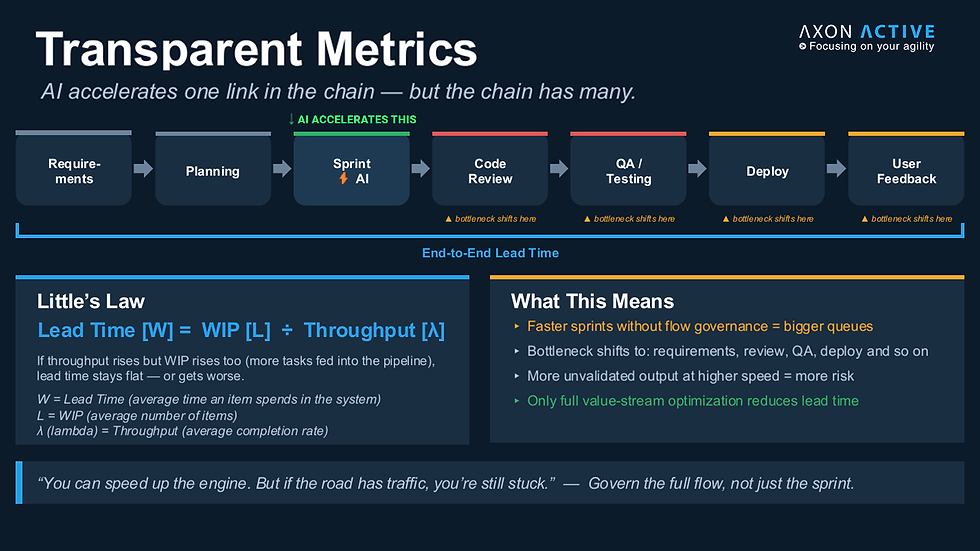
AI accelerates one link in the delivery chain. Lead time is governed by Little's Law: lead time = work-in-progress ÷ throughput. If only one link gets faster, the bottleneck shifts.
This is the governance question Little's Law makes precise. Little's Law states that the average time an item spends in a system equals the average number of items in the system divided by the average completion rate. In delivery terms: lead time equals work-in-progress divided by throughput. If a team uses AI to lift sprint throughput but does not also raise review and QA throughput proportionally, work-in-progress accumulates. Items pile up at the bottleneck. Lead time stays flat or gets worse. The faster sprint produced more output, but more of it is now sitting in someone's review queue, waiting.
This is why the standard pilot scorecard misleads. The pilot squad reports a 35% velocity gain at the sprint level. The CTO multiplies through and assumes the same gain at the delivery level. Then the actual delivery numbers come in flat, and everyone is confused. The pilot was not wrong. The flow was not governed. AI accelerated one link. The chain was not optimized end-to-end.
Flow governance, in our delivery model, means three things. First, measuring at the chain level — cycle time, defect density, code duplication — not just at the link AI is fastest at. Second, expanding capacity at the bottleneck rather than feeding more work into the unblocked stage. If review is the bottleneck after AI adoption, the answer is investing senior review capacity, automating the routine parts of review, and tightening the Definition of Done — not generating more PRs. Third, naming the bottleneck shift to the client up front, before it happens, so that when PR review time triples in week three the response is recognition rather than alarm.
Faster sprints without flow governance produce bigger queues, not faster delivery.
Expect a dip before the gain
There is one more piece of organizational reality the productivity data points at. AI gains are not instantaneous. In every transition we have run, there is a velocity dip in the first few sprints, before sustained gains appear in the months that follow.

This is consistent with the macro pattern in the productivity literature. THE DECODER's Frontier Radar synthesis of the historical comparison to the PC, the internet, and cloud computing suggests roughly a decade tends to pass between a technology becoming available and measurable productivity gains showing up in the aggregate data. The reason is not that the technology is slow; it is that organizations are. Workflows have to be redesigned. Measurement systems have to be built. Incentive structures have to be adjusted. Accountability frameworks have to be created. None of this happens in a single sprint.
At the squad level, the same dynamic plays out compressed into weeks. In the first sprint after AI adoption, the team is figuring out which prompts work and which produce workslop. Working agreements get tightened. Review capacity gets expanded. Prompt libraries get built. Within a few sprints, the team is operating in a steady state with the new tooling — and from there, sustained gains in cycle time and quality become visible.
We tell our clients this in the assessment phase, not after the dip starts. The honesty is itself part of the differentiation. Most AI consultancies pitch the upside without the transition cost. We pitch both, because both are real, and a CFO who sees the dip without being warned will quite reasonably conclude the project has failed.
How we do this at Axon Active

Our AI Transition Framework — backed by the AI Adoption Leadership Handbook (March 2026) we use internally — puts the measurement discipline into practice. Four stages, run as a continuous cycle:
Assess. Two to three weeks. We map team maturity, codebase risk, and compliance context, and produce a recommended AI Responsibility Level per workstream. The output is a 90-day transition roadmap, not a one-size-fits-all rollout.
Enable. Dojo sessions in your actual codebase. AI Coaches embedded with squad leaders. Working agreements that define where AI is allowed and forbidden. Prompt libraries pre-built for your environment. Tool selection matched to the AI Level and the compliance context.
Govern. Four AI Responsibility Levels — Assisted (Level 1), Augmented (Level 2), Supervised (Level 3), Orchestrated (Level 4) — that classify how responsibility is shared between human and AI on a given task. Definition of Done with AI-specific clauses. Security pipeline. The 3-Prompt Rule (escalate rather than persist when AI is not moving a problem forward).
Measure. Cycle time, PR review time, defect density, velocity accuracy, code duplication. Reported transparently to the client. If AI is not delivering, we say so and adjust.
The cycle is continuous. Measurement triggers re-assessment. Re-assessment refines the working agreements and the AI Levels. Refined governance shows up in the next sprint's measurement. This is the operational form of the position described in the companion piece, AI Changes the Practice. The Scrum Team Stays. — practice evolves, the team stays, governance is the work.
Why this matters
The standard playbook is to sell tools and hope the productivity follows. We measure the productivity and govern the conditions that produce it. That is a different business model. It is the one that fits the Axon Model — Swiss-quality dedicated-team engineering that has worked for our regulated clients for fifteen-plus years — and it is the one we have committed to for the next decade of AI delivery.
The question your finance team is going to ask you is not how many developers used AI last quarter, or how many lines of code were generated. It is whether the cycle time improved, whether the defect rate held, whether the customer noticed anything different. Those are the questions we built our measurement framework to answer — honestly, transparently, and on a timeline that includes the dip before the gain.
If your AI rollout is not yet showing up in the metrics that matter, that is not a sign the technology has failed. It is a sign the chain has not been governed. We can help with that.
Sources and further reading
All sources used in this article, with direct links to the original research.
Productivity research and field studies
Brynjolfsson, Li, and Raymond — Generative AI at Work (NBER Working Paper 31161; published in The Quarterly Journal of Economics, vol. 140(2), 2025). Field experiment with 5,179 customer support agents; 14% productivity gain on average, 34% for novices.
Cui, Demirer, Jaffe, Musolff, Peng, Salz — The Effects of Generative AI on High-Skilled Work (Management Science, February 2026). Three field experiments with 4,867 software developers across Microsoft, Accenture, and a Fortune 100 firm; 26.08% increase in completed tasks.
Paradis et al. — How much does AI impact development speed? Google enterprise RCT with 96 developers; about 21% speedup on coding tasks.
METR — Measuring the Impact of Early-2025 AI on Experienced Open-Source Developer Productivity (July 2025). 16 experienced developers, 246 tasks; 19% slowdown observed despite developers expecting 24% speedup. METR's February 2026 follow-up with 57 developers shows smaller, less certain effects in newer cohorts.
St. Louis Fed — The Impact of Generative AI on Work Productivity. Bick, Blandin, and Deming. 5.4% time savings among active users; 1.4% workforce-wide; 1.1% potential productivity gain. State of Generative AI Adoption update (November 2025).
Humlum and Vestergaard — Danish registry study. Linked AI-usage surveys with administrative labor-market data; zero detectable effects on income or hours after two years.
Aldasoro et al. — European firm-level study (BIS Working Paper). 4% labor productivity gain in firms with complementary IT, data, and training investments.
AI's hidden costs in knowledge work
Niederhoffer, Rosen Kellerman, Lee, Liebscher, Rapuano, Hancock — AI-Generated 'Workslop' Is Destroying Productivity (Harvard Business Review, September 2025). BetterUp Labs / Stanford Social Media Lab survey of 1,150 US workers; 40% report receiving workslop, 1 hour 56 minutes per incident, ~$9M annual cost in a 10,000-person firm.
Bedard, Kropp, Hsu, Karaman, Hawes, Kellerman — When Using AI Leads to 'Brain Fry' (Harvard Business Review, March 2026). BCG Henderson Institute survey of 1,488 US workers; 14% report cognitive exhaustion from AI oversight.
Shen and Tamkin — How AI Impacts Skill Formation (Anthropic, January 2026). Randomized controlled trial with 52 developers learning the Trio Python library; 17% worse knowledge-test results among AI users, with the gap depending on whether AI was used for explanation or delegation. Full paper on arXiv.
Adoption baseline, technical debt, and synthesis
Stack Overflow — 2025 Developer Survey. 84% of developers use or plan to use AI tools, up from 76% in 2024. 51% of professional developers use AI daily.
McKinsey Digital — Breaking technical debt's vicious cycle to modernize your business. Technical debt accounts for ~40% of IT balance sheets; 30% of CIOs report >20% budget diversion. Active management can free engineers to spend up to 50% more time on value-creating work.
Stripe — The Developer Coefficient. 42% of professional developer time goes to managing technical debt and bad code.
THE DECODER — Frontier Radar #2: Why AI productivity gets lost between benchmarks and the balance sheet (March 2026). Synthesis of 20+ academic and institutional sources on the gap between task-level AI gains and economy-level productivity.
Mike Cohn — The Cost of Change Curve Is Outdated (Mountain Goat Software, March 2026). AI is flattening the cost-of-change curve; the bottleneck shifts from development effort to feedback delay. Supports the article’s argument that saved time only creates value when redirected through better feedback loops.
Bill Cox — AI at the Helm: The AI-Driven Revolution in Software Coding and CodeRhapsody. 240,000 lines of personal AI-supervised practice; the 35,000 vs 58,000 lines comparison; the 'harness' concept of structural discipline around AI.
Sauermann — Performance measures and worker productivity (IZA World of Labor). On the principle that once an observable metric feeds into evaluation, people optimize for the metric — not the underlying value.
Companion article
AI Changes the Practice. The Scrum Team Stays. The companion piece on how to organize AI-augmented delivery teams.
The Invisible Line Between Vibe Coding and Professional AI Engineering. Why software development needs both — and how to know which one you’re doing